
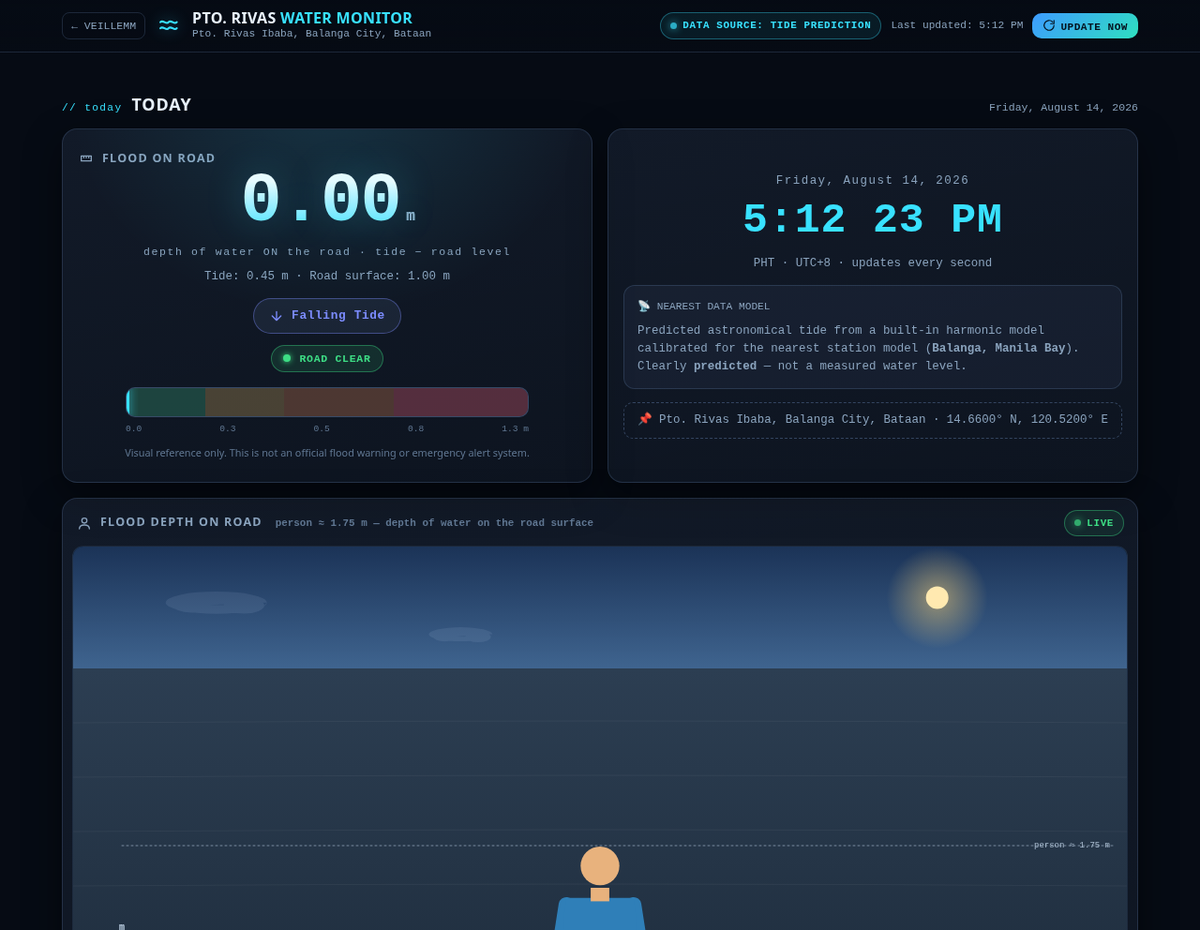
The problem: a road that floods every high tide
Pto. Rivas Ibaba in Balanga City, Bataan sits right on the shoreline of Manila Bay. Its main road floods almost every day — not because of rain, but because of the tide. Every ~10 AM to 2 PM the water rises past the road surface, and residents simply… learn the schedule by heart. Miss it, and you're wading through ankle-deep water in slippers.
The fix isn't a seawall — it's information. If everyone in the barangay could see, at a glance, whether the road is clear, when the next flood starts, and how deep it will get, a daily nuisance becomes a manageable routine. So I built that: a single-file web app that predicts the water level with real tide science, and explains it with a picture everyone understands — a person standing in the water.
Why a 3D human instead of a graph
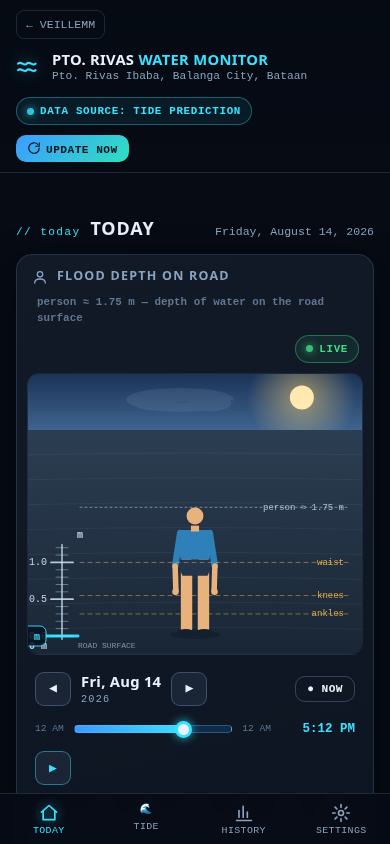
Tide charts are great for mariners and useless for everyone else. A resident doesn't want to read 1.76 m above datum — they want to know if the water is at their ankles or their waist. So the centerpiece of the dashboard is a 3D human figure standing on the road, with the water level drawn in real time against their body.
The water rises and falls smoothly in front of you, the ruler on the side shows the exact depth, and a caption answers the real question: "Water reaches: KNEES · 0.42 m". You can even change the person's height in settings, because the reference point should be you.
A Windy-style tide explorer
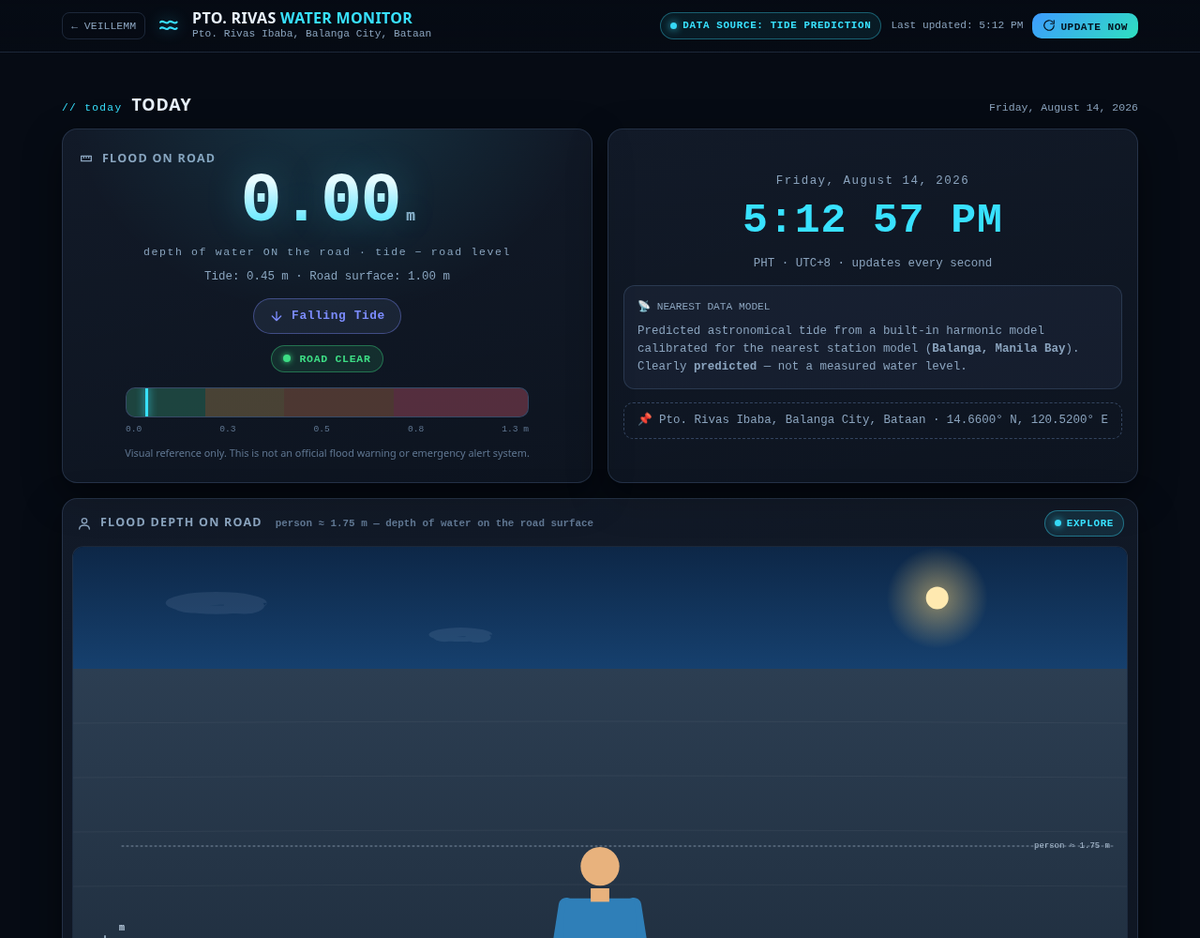
A live snapshot is useful, but the question residents actually ask is "will it flood tomorrow morning?". So I built a tide explorer right under the model — the same pattern Windy uses for weather: scrub through time and watch the scene respond.
- ◀ ▶ day stepper — jump backward or forward, day by day, keeping the same time of day.
- 24-hour time slider — drag through the day and watch the water rise and fall in the model instantly.
- Play mode — auto-plays through the whole day, then rolls into the next one.
- 7-day strip — each day shows its maximum flood depth as a mini-bar; tap a day to jump straight to its peak. Dangerous days glow red.
- High/low tide line + moon phase — because tides run bigger around new and full moons, and now residents can see exactly when.
- Sky follows the clock — explore 3 AM and the scene goes dark; noon is bright. It makes the time-of-day legible at a glance.
The hard part: a tide model that stays accurate forever
Here's where this project stopped being a toy. A dashboard that guesses wrong tomorrow isn't a dashboard — it's noise. And I wanted this to be something the barangay could leave running for years. So the tide prediction had to be real science, not a hand-tuned curve.
Real tide tables are generated with harmonic analysis: the tide at any moment is the sum of dozens of periodic constituents, each with its own frequency, amplitude and phase — plus slow astronomical corrections that keep the prediction valid for decades.
level(t) = Z0 + Σ f_c(t) · H_c · cos(σ_c · t + u_c(t) − g_c)
           └──────────┬─────────┘   └─────────────┬────────────┘
          mean sea level                each tidal constituent
          (offset)                      (M2, S2, K1, O1, …)
That's it — the same method behind official tide tables, running in the browser.
Fitting 21 constituents to real data
A model is only as good as its constants. I scraped 13 months of real Balanga tide tables — 1,144 observed high/low events — and fitted the amplitudes and phases with a least-squares solver. Then came the part that makes it permanent: the node factors f_c and nodal corrections u_c, which track the 18.6-year lunar cycle. Those corrections are exactly what keeps a hand-fitted model from drifting away from reality as the years pass.
I validated the fit against months of data the solver had never seen:
- ~4 cm average error in water height (test period: Jun–Sep 2027)
- ~12 min median error in high/low tide times, ~29 min at the 90th percentile
- Verified to 2055 — the prediction doesn't degrade, because the astronomy keeps correcting it
// tide check
The single biggest high tide each day drives the flood. Fitting K1 and O1 (the diurnal constituents) correctly was what turned a two-tides-a-day model that flooded the road at 5 PM into the real Balanga pattern: one big high tide around 10 AM, and a small, harmless night high.
Calibrating the road level — from what you see
The tide height alone isn't the flood. The flood is tide − road level, and the road level is a local secret only residents know. So the dashboard ships with a calibration flow that any non-technical user can operate:
- Look at the road right now and type how deep the water is (e.g. 0.35 m).
- The 3D model previews the result live while you type — you see the water move to the depth you described before saving anything.
- Press Set road level from this and the dashboard computes the road elevation for you.
There's even an optional "when did you see it?" field — because if you're calibrating at 4 PM about a flood you saw at 1 PM, the tide has already moved. The math uses the tide at the time you actually saw the water, which makes the calibration dramatically more accurate.
Weather: the one thing the tide table can't know
A harmonic model predicts the astronomical tide perfectly — but a typhoon can push the real water a good 10–20 cm higher. That's the difference between a clear road and a flooded one. So the dashboard includes a weather adjustment: a simple dropdown in settings (dry / light rain / heavy rain / storm / severe surge) that adds the estimated extra water height on top of the tide, everywhere — the model, the graph, the verdict banner, and the 7-day outlook.
Designing for a phone, because that's where residents live
Almost everyone in the barangay will open this on an Android phone. That changed the design decisions:
- The 3D model loads first — before any card, before any chart. One glance at the person in the water and you know the situation.
- A flood verdict banner — a full-width 🟢🟡🔴 strip under the model that reads "ROAD CLEAR" or "FLOOD NOW" with the exact depth, plus the next flood time and peak.
- A 7-day outlook that scrolls horizontally on small screens — each day color-coded HIGH / MODERATE / LIGHT / CLEAR, tappable to explore.
What this taught me
Building this forced me to cross into territory I'd never touched as a web developer — spherical astronomy, least-squares fitting, and the 18.6-year lunar nodal cycle. The lesson wasn't the math. It was that a real problem in the real world doesn't care about your stack — it cares whether your answer is right. A simple single-file app with honest science beats a flashy dashboard that's wrong on Friday.
// lesson
The best visualization for a problem is the one the user already has in their head. Residents don't think in meters above datum — they think in "up to my knees." Put the data in that shape and the app practically uses itself.
Ship it
The dashboard is live at water-level-monitor/index.html — one self-contained HTML file, no build step, no server. Open it on a phone, set the weather if it's raining, calibrate the road once from what you see, and it will quietly predict the sea for years. That's the kind of project I want to build more of: small, honest, and genuinely useful to real people.